In-App Help was last updated in 8.6.4 (released 10/23/2019) if you are looking for help with a feature that has been added or enhanced since 8.6.4, please check in Online Help from Help menu.
The Census by Hour of Day Report
This report compares the midnight census to the real-time census by hour of day and day of week over a selected date range. This report includes raw data for a date range or average data by day of week for a date range.
This report requires the implementation of the Registration Import to calculate the census and can only be run on profiles that have the required mappings configured in Demand Manager.
Running the Census by Hour of Day Report
Complete the following steps to the run the Census by Hour of Day report:
- From the Reports menu, select Demand > Census by Hour of Day. The selection criteria page opens.
- Select one or more facilities. Use CTRL+click to select multiple items. Use SHIFT+click to select a range of items.
- Select one or more profiles.
-
Enter a start date in the box or click the calendar icon to use the date menu.
-
Enter an end date in the box or click the calendar icon to use the date menu.
- Select a Display Census By option. Available options are Profile and Location.
- Select an Include Hourly Census by Date? option. Available options are Data Only, Data and Charts, and None.
- Select an Include Average Hourly Census by DoW (Day of Week)? option. Available options are Data Only, Data and Charts, and None. Selecting None for both the Include Hourly Census by Date and Include Average Hourly Census by Day of Week disables the Run Report button. You cannot select None for both of these options, only one or the other.
- Select an Export Type.
- If you select PDF, Clairvia Web opens the report results as a PDF.
- If you select Microsoft Office Excel, Clairvia Web exports the report results as an Excel spreadsheet. You must have Microsoft Office Excel or Excel Viewer installed on your workstation to use this option.
- If you select CSV, Clairvia Web exports the report results as a comma separated values file. Be aware, however, that the CSV option does not support charts. If you previously selected either of the Data and Charts options, the CSV file only includes the data.
- Click Run Report. If you selected the PDF export type, the report is displayed in the Report Output pane. If you selected either the Excel or CSV export type, an alert window opens to allow you to select whether to open the report or to save the report. We recommend selecting Save so that you can review the report in the appropriate application.
Note: Be aware that report formatting is not always retained when you export a report to Excel or CSV format. Opening a CSV file in Excel may change the format of the data. To view CSV files as they are exported from Clairvia, it is recommended that you open the file in a text editor application such as Notepad.
Viewing the Census by Hour of Day Report
This report displays the hourly census for each day in the selected date range and compares it to the midnight census for the same day or days. The report includes:
- Selected date range (such as 3/1/2016 through 3/17/2016)
- Profile or Profile : Location (depending on your selections)
- ADT Index: The ADT Index value is calculated by taking the number of admissions, discharges, and transfers from midnight to 23:59 divided by the census at 23:59 so that the activity comes before the census value used.
- Daily Averages
- Hourly Census by Date (if selected)
- Average Hourly Census by Day of Week (if selected)
If the hourly census value is greater than the midnight census, a black triangle is displayed in the upper-right corner of the chart. If the hourly census is less than the midnight census, a black triangle is displayed in the lower-left corner. If the two values are the same, no triangles are displayed.
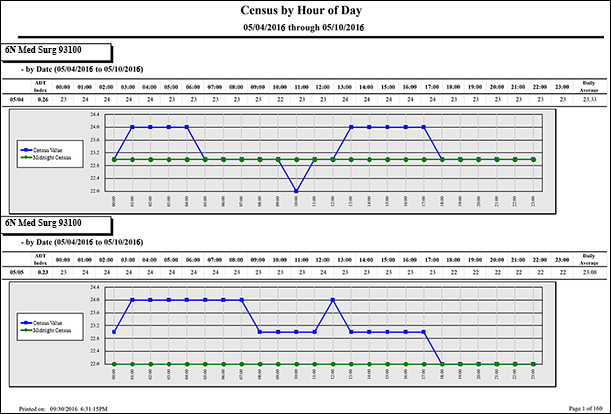
Depending on the selections you made when running the report, the report may also have a graph plotting the midnight census (shown as a green line) against the hourly census (shown as a blue line).
Sample Reports
The Census by Hour of Day Report can look very different depending on the options you select. The following illustration show some, but not all, of the different results.
In the following report, the user made the following selections:
- Data and Charts for the Include Hourly Census by Date
- Data and Charts for the Include Average Hourly Census by Date
- Export Type PDF

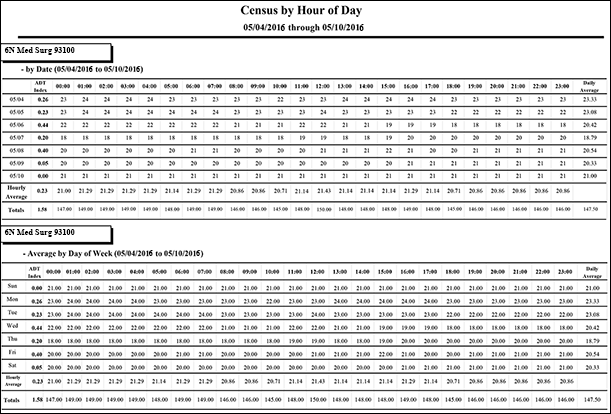
In the following report, the user made the following selections:
- Data Only for the Include Hourly Census by Date
- Data Only for the Include Average Hourly Census by Date
- Export Type PDF

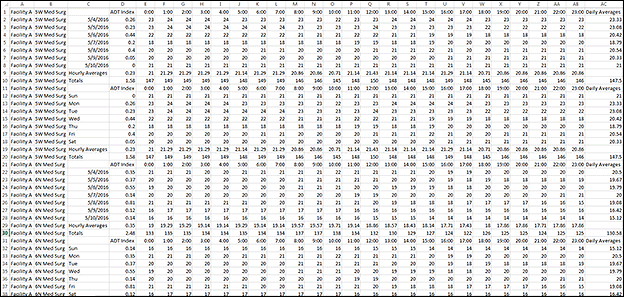
In the next two illustrations, the user chose to export the report as a CSV file. The first shows the CSV report opened in a text editor such as Notepad.

The second shows the same CSV report opened in Microsoft Excel.

 Related Topics


